Transport
re:cycling
30 January 2026
Let's talk about cycling
Problem Statement
When cycling paths don't connect properly, Singaporeans can't use them to get to work or school, forcing more people into cars and buses. Despite significant investment and positive public messaging, Singapore's cycling path network continues to fall short of providing genuine last-mile connectivity for everyday trips. Our analysis of 203 MRT and LRT stations reveals that 42% have poor cycling connectivity, and cyclists face an average of 12 interruptions per kilometre around stations.
Current reporting emphasises headline distance figures—like the target of 1,300km by 2030—which do not capture real-world usability factors such as network fragmentation. At the same time, the planning and implementation process remains largely opaque, making it difficult to assess whether built outcomes align with policy intent or to identify where targeted improvements are most needed.
Objectives
1. Develop a clearer understanding of how cycling path networks in Singapore are planned and implemented across agencies.
2. Explore alternative metrics and more transparent ways of representing cycling path networks, beyond total kilometres built.
3. Examine how structured feedback on cycling infrastructure could be collected and shared to better inform planning, implementation, and future iterations.
Approach
Speaking to LTA AMG (Active Mobility Group)
To understand why cycling paths often feel fragmented, we spoke with officers from LTA's Active Mobility Group. While planners start with good intentions, connecting MRT stations within 400-600 metres using major roads as primary spines, land constraints force compromises that create gaps. Trees, drains, road widths, and other land uses frequently result in narrower-than-ideal paths, shared-use configurations, or localised discontinuities. These individual trade-offs seem reasonable in isolation, but cumulatively result in the fragmented network that cyclists experience today.
Initial batches of cycling infrastructure were delivered in response to demand hotspots rather than through a fully integrated masterplan, leaving behind legacy gaps that LTA now seeks to address. Feedback mechanisms are largely unstructured and case-based, handled one at a time through existing LTA systems. While effective for resolving localised concerns, this approach makes it difficult to surface broader patterns related to connectivity or network coherence, reinforcing the need for clearer metrics and more transparent representations.
Rethinking How Cycling Networks Are Measured
LTA currently reports progress primarily through kilometres of cycling paths built. While distance is useful for tracking delivery, it creates a disconnect between reported progress and lived experience. Even as total network length increases, cyclists may still encounter fragmented routes that make cycling slower than walking.
From reviewing international approaches, we identified three metrics that better reflect what cyclists experience on the ground:
Cycling-to-road ratio captures whether cycling infrastructure is proportionate to vehicular infrastructure in a given area, reflecting LTA's planning process of aligning cycling routes along roads.
Fragmentation index measures average cycling path segment length, reflecting how interruptions can have outsized effects on usability. Our analysis shows cyclists face 12.44 interruptions per kilometre on average around stations.
Last-mile connectivity centres analysis on connections within 1km of MRT stations, aligning with Walk-Cycle-Ride objectives where cycling substitutes for short motorised trips.
Together, these metrics provide a conceptual foundation for evaluating cycling networks beyond distance alone. In the following section, these ideas are operationalised through a map visualisation that applies each metric consistently across existing and planned cycling paths, allowing differences in network quality to be considered spatially rather than inferred from aggregate figures.
Field Work
We conducted on-site observations and interviews with cyclists and pedestrians around Jurong East MRT and Toh Guan Road to understand how planned infrastructure performs under real usage conditions.
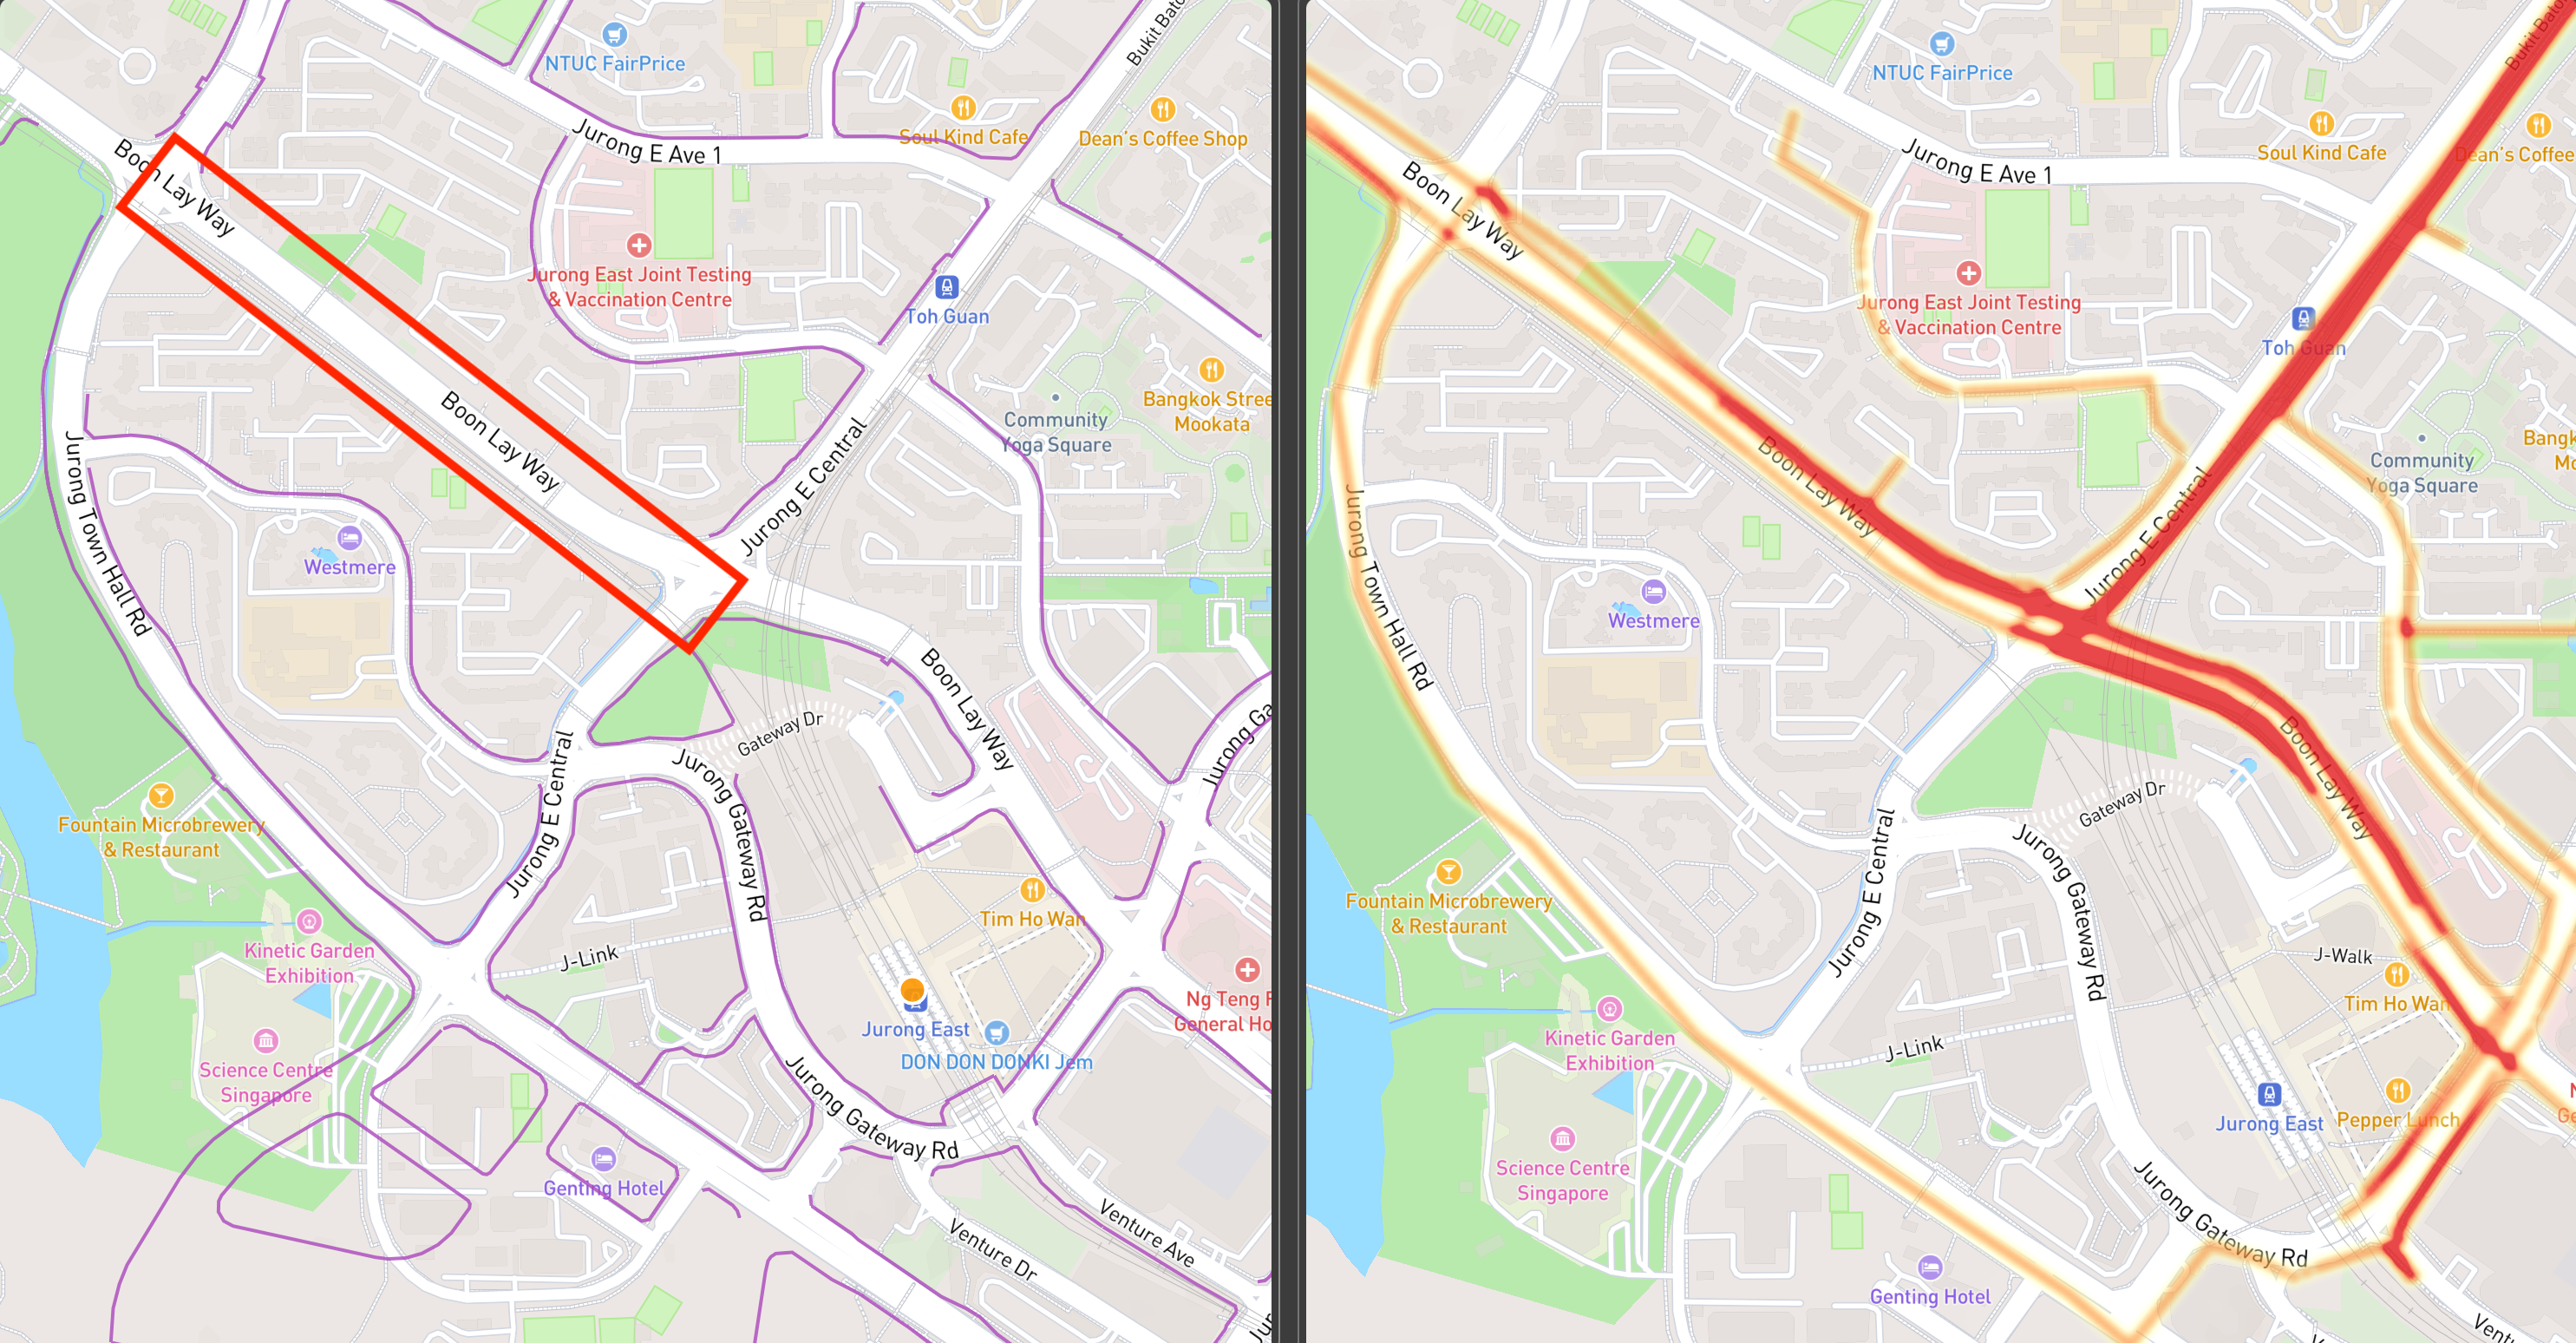
Image on the left depicts planned cycling routes for 2040 (purple). Image on the right depicts existing user routes (orange-red).
Observations confirmed that the core planning logic is directionally sound. Aligning cycling paths along major roads provides a clear backbone for movement. However, implementation creates significant inconsistencies. Major roads functioning as obvious desire paths weren't fully connected. Cycling paths merged into narrow pedestrian spaces create persistent safety conflicts, with users consistently flagging issues where differing speeds and directions increase friction. These findings point to the value of treating cycling paths as a distinct backbone network, separate from walking infrastructure where feasible.
Field work also exposed critical gaps in ancillary infrastructure that undermine otherwise functional routes and are not visible in existing metrics: absence of wayfinding from estates and MRT stations makes navigation difficult without local knowledge; unclear separation at junction crossings creates conflict points; lack of well-located bicycle parking reduces the usefulness of cycling for end-to-end trips; and construction works frequently force cyclists onto significantly longer detours.
Many cyclists reported travelling 1–4 kilometres daily, far exceeding the 400–600 metre catchment assumptions used in planning. This matters: challenges in Jurong East stem less from the absence of cycling infrastructure and more from how routes are configured and supported. Distance-based metrics alone miss what's actually shaping the cyclist experience, namely continuity, safety, and real travel behaviour on the ground.
Solution
We focused on translating our process insights and ground observations into tools that make the cycling path network easier to evaluate, discuss, and iterate on. Rather than proposing new data collection mechanisms upfront, we explored how existing datasets could be reinterpreted to better reflect connectivity, usability, and real-world experience.
Based on the learnings above, we developed two complementary tools: a map visualisation to provide clearer, network-level metrics, and a heatmap-based feedback layer to surface on-the-ground issues that are otherwise difficult to capture systematically.
Map Visualisation
Our analysis of 203 stations (159 MRT, 44 LRT) shifts attention from headline distance figures towards measures that reflect how cycling paths function as a network.
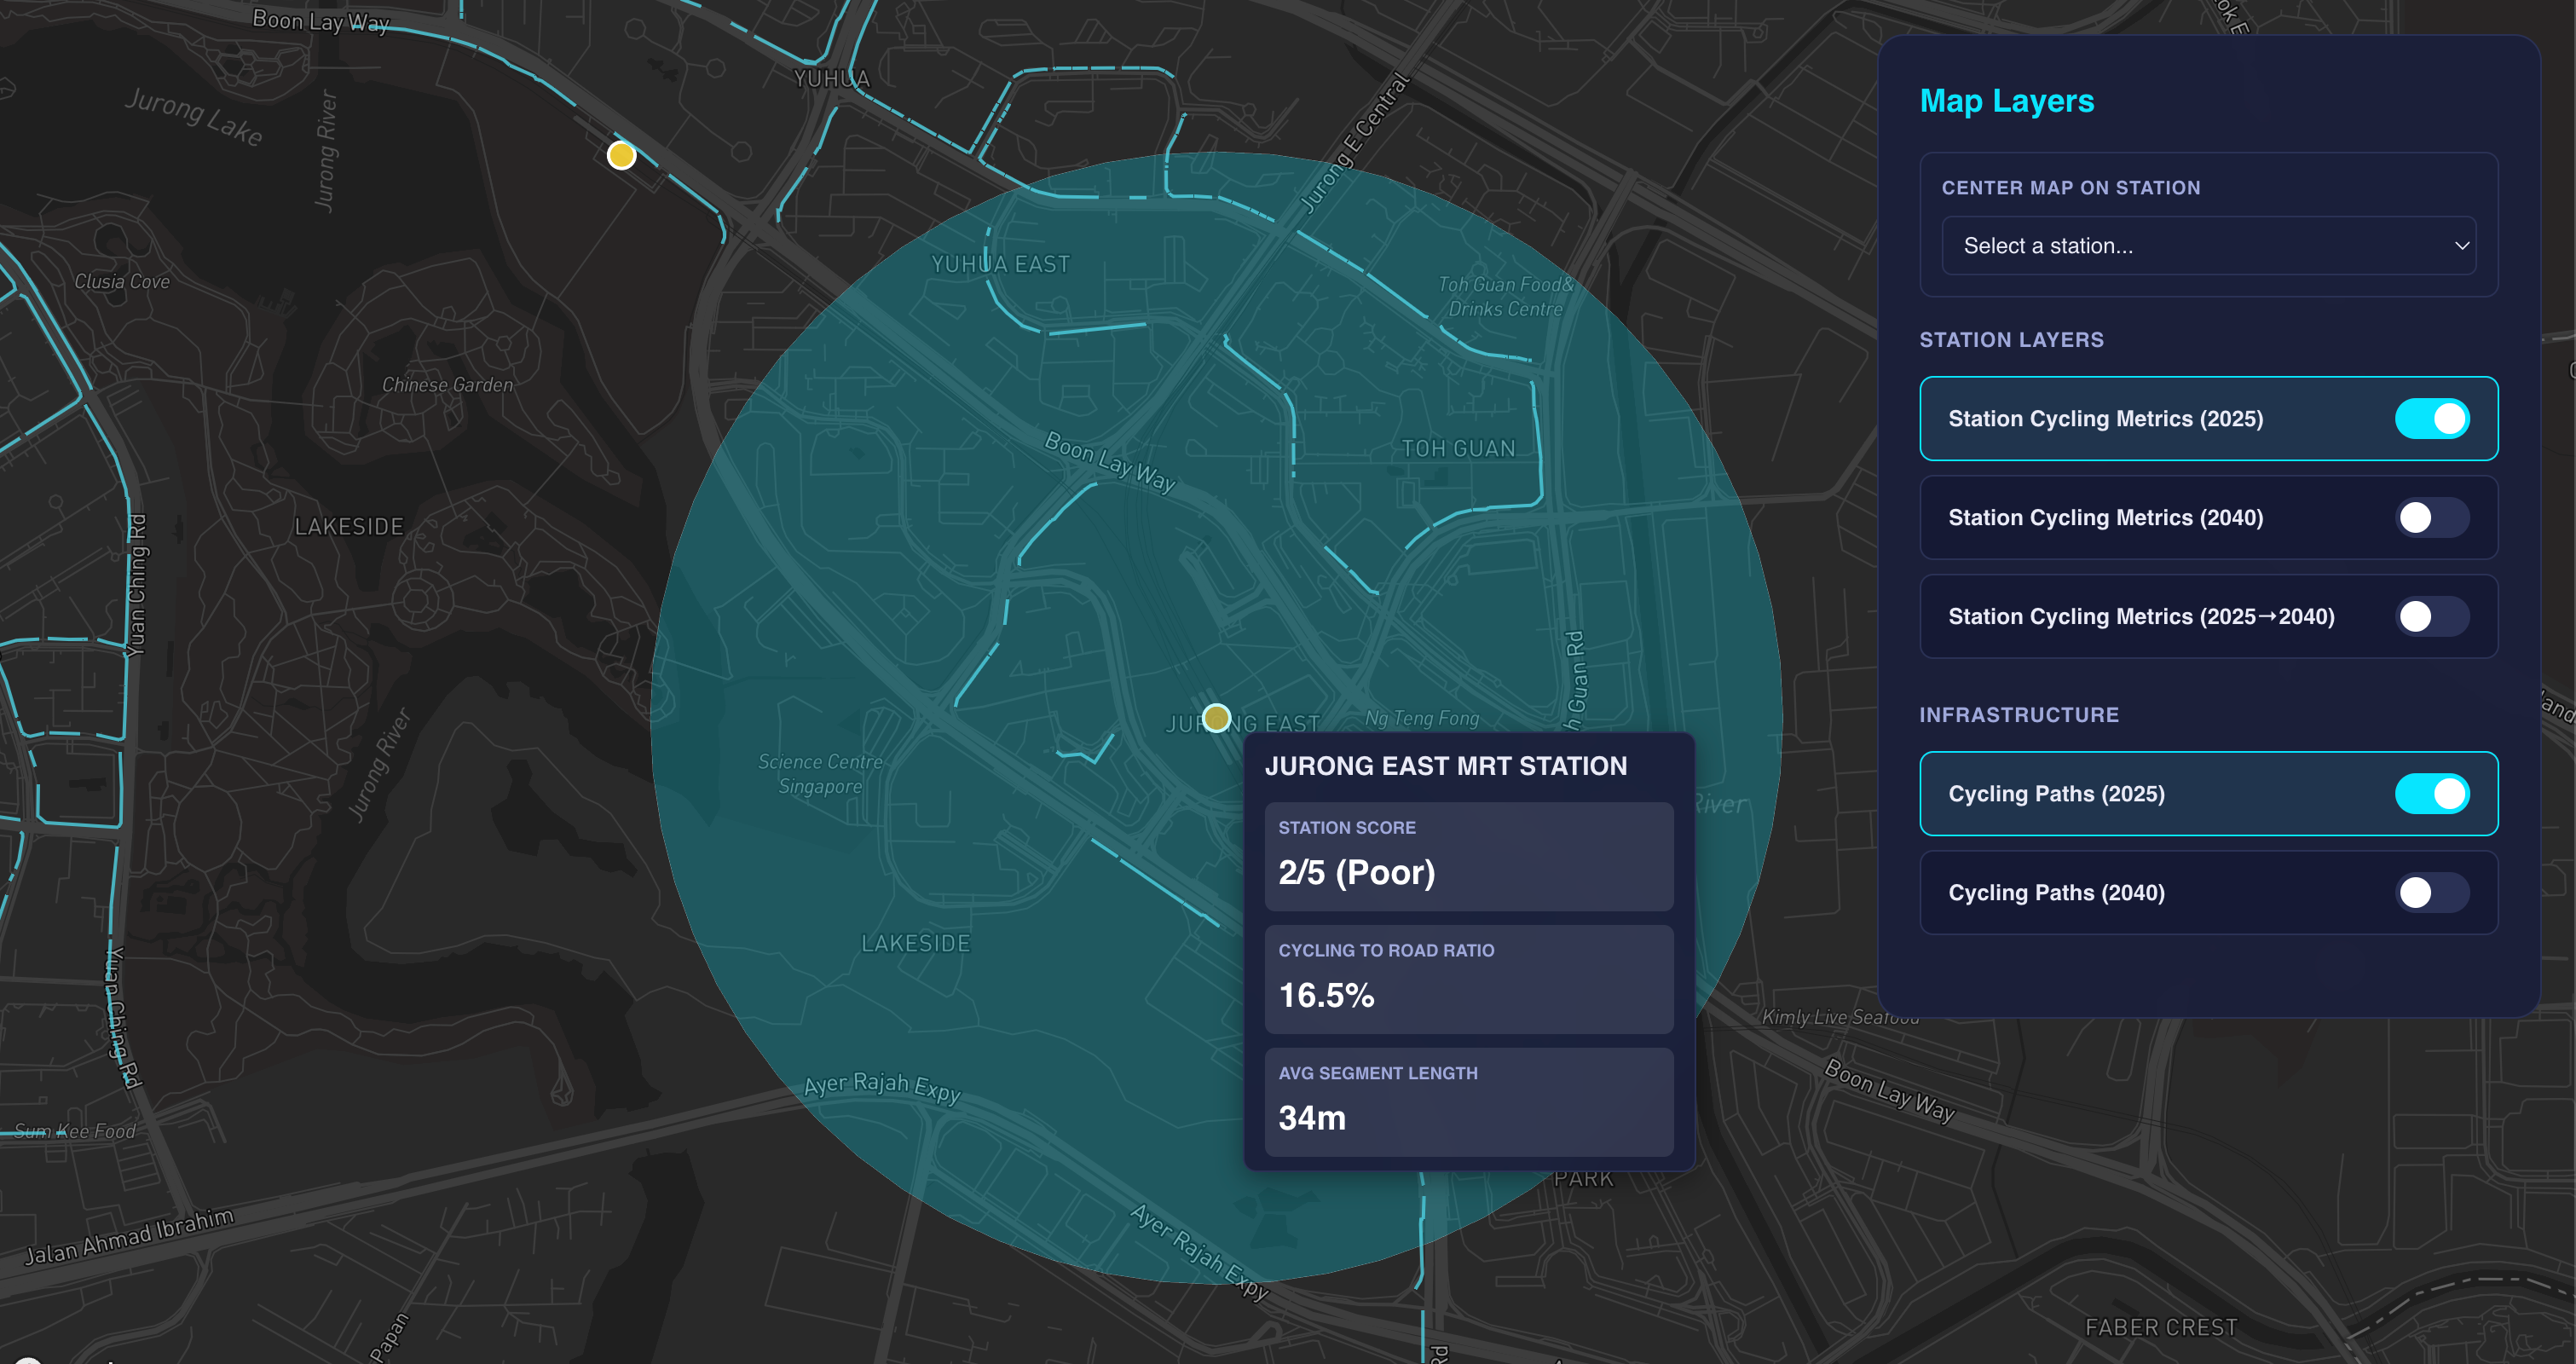
Map examining the cycling infrastructure score for Jurong East MRT station
The visualisation reframes how cycling infrastructure is measured. Rather than reporting total network length, it examines last-mile connectivity within 1km of MRT stations, reflecting how cyclists realistically access public transport. It contextualises cycling infrastructure by measuring the ratio of cycling paths to vehicle roads, highlighting where cycling provision lags behind vehicular capacity. And it surfaces network continuity through fragmentation analysis, showing where paths are broken into short segments that undermine safe travel even when overall distance targets are met.
Key findings reveal that cycling infrastructure remains disproportionate to the surrounding road environment: the average cycling-to-road ratio is 19.7%, just below the 20% "good" threshold, with the median at just 11.5%. Only 25% of stations have good or excellent cycling infrastructure.
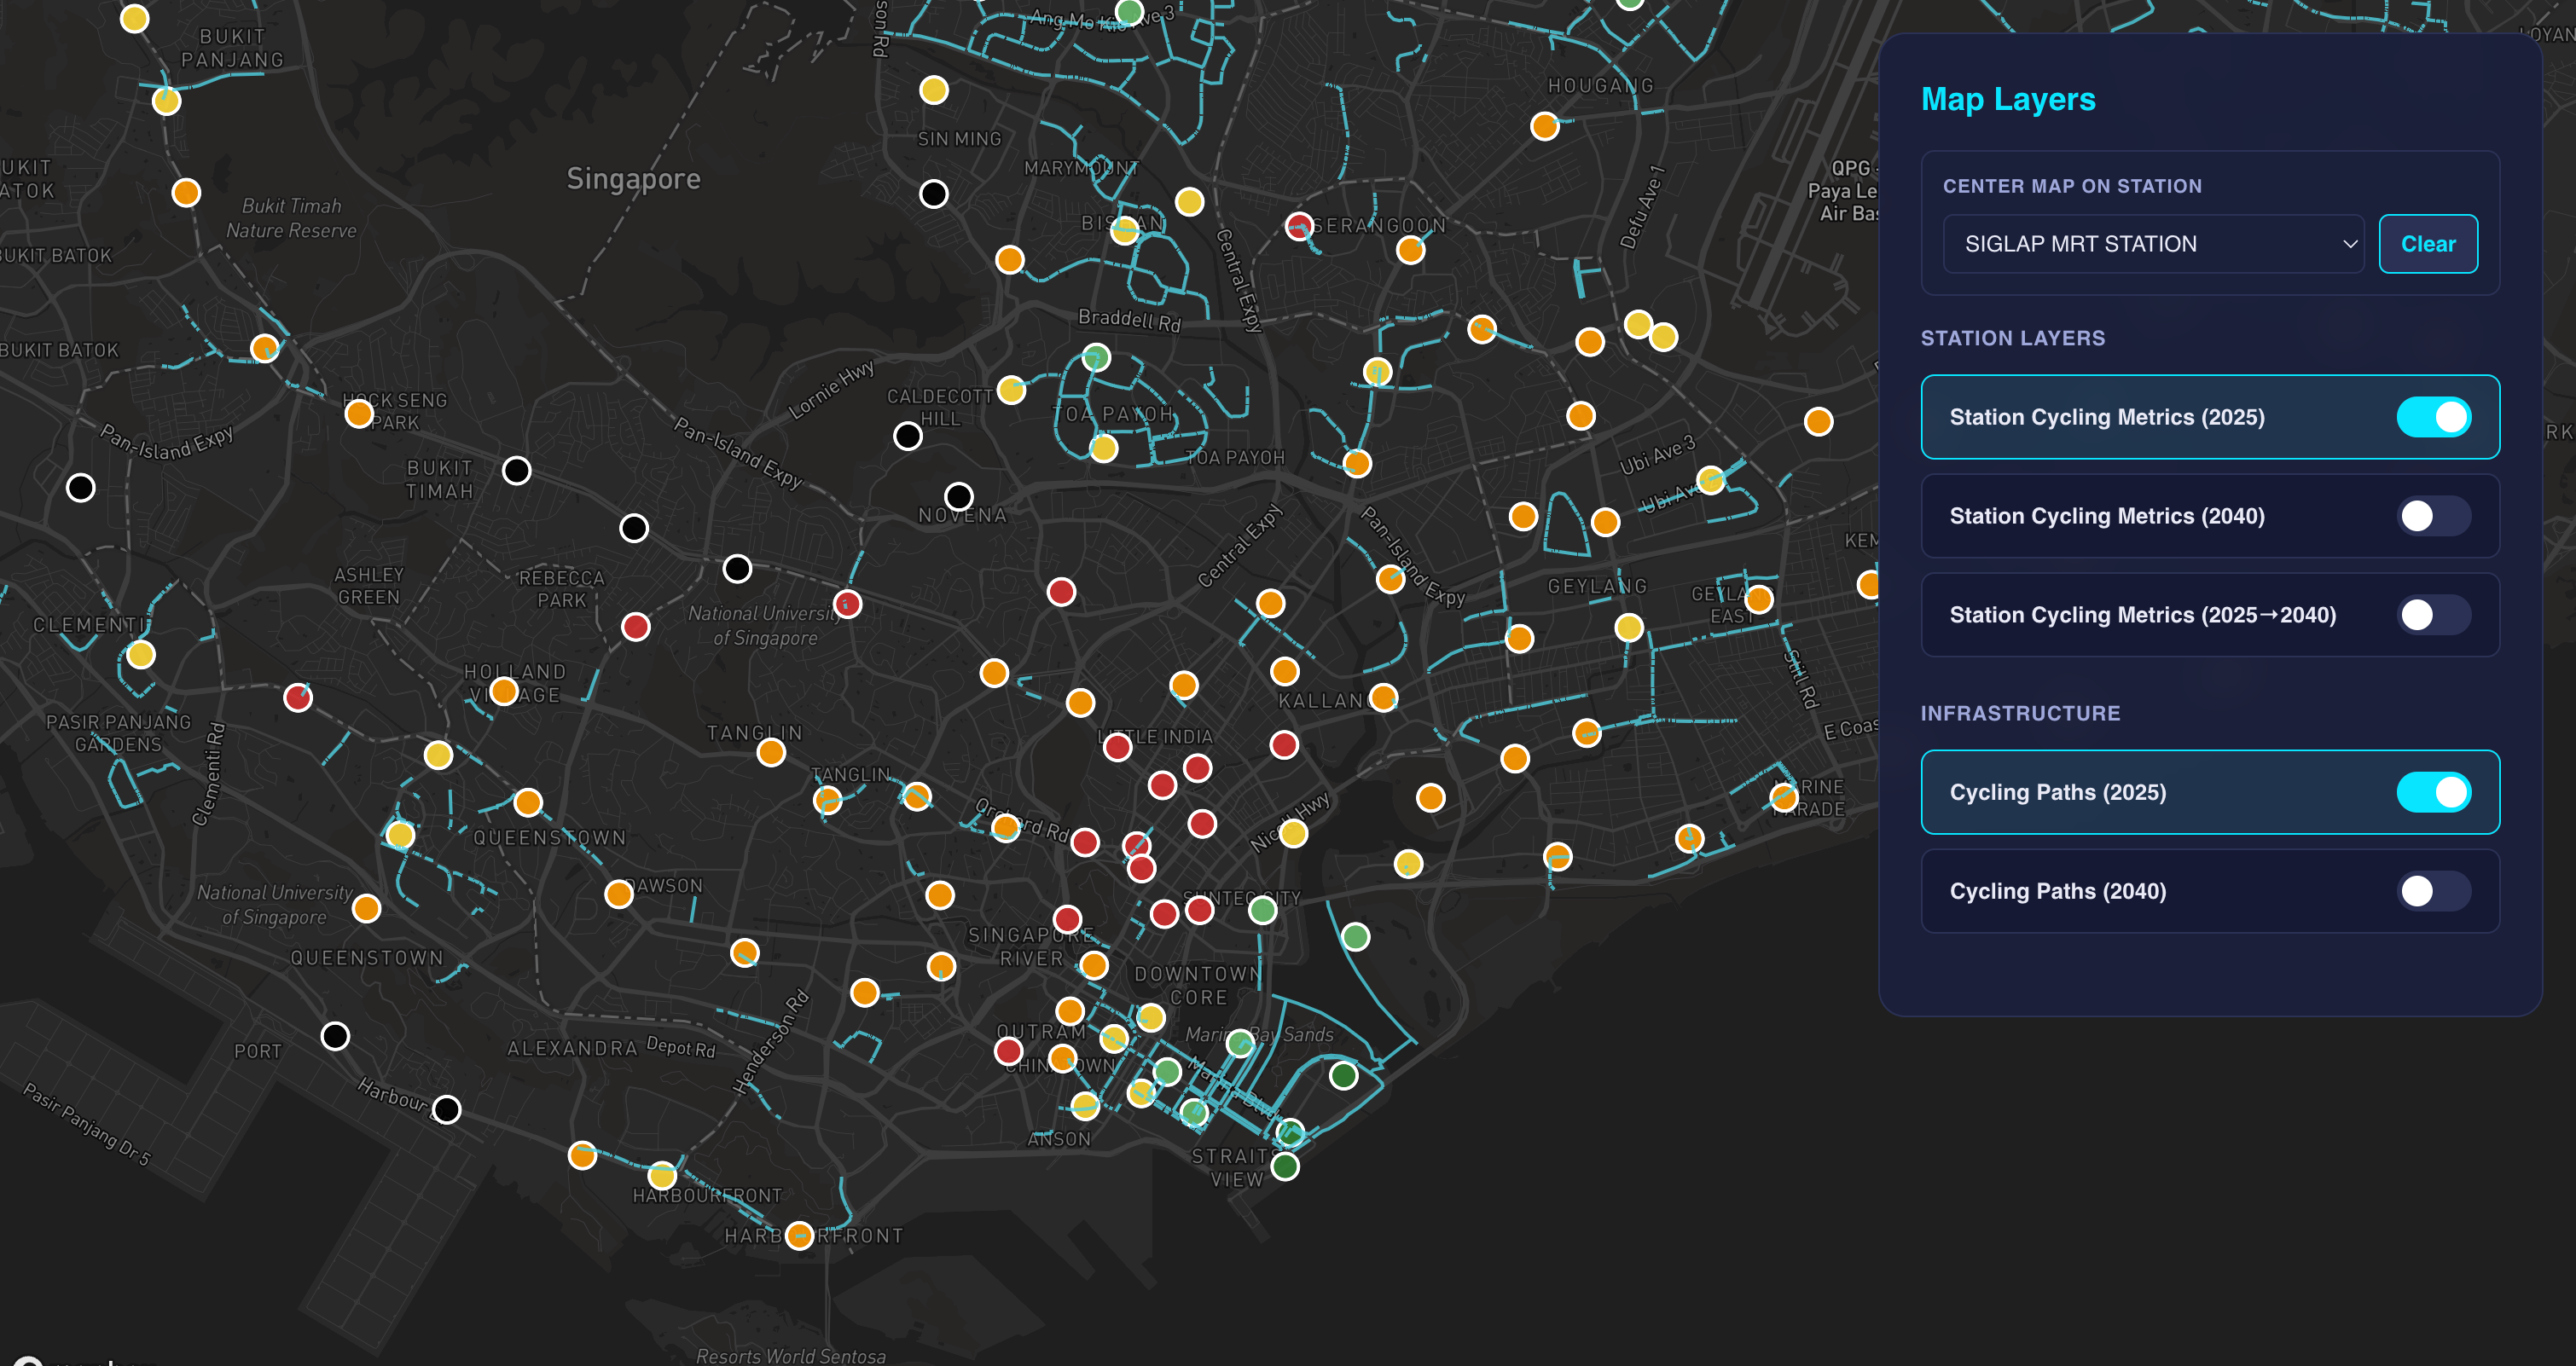
Map visualisation of Singapore’s MRT stations, colour-coded by cycling connectivity scores
Together, these views allow users to compare existing and planned networks and quickly identify where cycling paths function as a coherent system, and where improvements on paper may not translate into better real-world usability.
Users can access our map visualisation tool at : https://re-cycling.hack2026.gov.sg/
Feedback Tool
We developed a heatmap-based tool to collect feedback on cycling infrastructure directly from cyclists and the public. Rather than measuring infrastructure coverage, the tool captures cyclists' preferred routes between homes and MRT stations. Visualised as a heatmap, this feedback surfaces spatial patterns of demand not visible through network metrics alone.
Aggregated route preferences reveal which links matter most to users, where gaps introduce the greatest friction, and which interventions will have the highest real-world impact. Used alongside the network metrics, the heatmap can inform the sequencing of builds by grounding planning decisions in actual cyclist demand. Crucially, direct engagement with residents during testing surfaced practical insights that no amount of theoretical planning could capture. This on-the-ground context is easily lost when planning happens at a distance. There is a real opportunity to integrate qualitative feedback through LTA's existing channels, ensuring that lived experience shapes infrastructure decisions rather than being filtered out of the process.
Future Vision
When we shared this work with a Member of Parliament, they noted that clearer, demand-driven information could enable town councils to step in with targeted local interventions where central prioritisation is constrained. This response reinforces a core finding: by making network gaps, desire paths, and usability issues visible at a local scale, these tools unlock localised solutions that would otherwise remain invisible to central planning. More broadly, this creates a basis for wider participation, allowing agencies, town councils, and potentially private partners to identify where localised investments could meaningfully improve cycling outcomes.
The work also points toward a concrete shift in how cycling infrastructure is prioritised. Given that current planning logic, anchoring routes along major and minor roads, is directionally sound, the next step is to more explicitly define a cycling backbone distinct from walking infrastructure and prioritised for continuity. This backbone should be supported by ancillary infrastructure: clear wayfinding, safe crossings, and bicycle parking that guide cyclists toward these routes. This approach improves usability without requiring vast new cycling networks, focusing investment where it matters most.
These tools support clearer, more informed decision-making by introducing metrics directly aligned with stated policy objectives. By making progress transparent through interpretable, network-level measures rather than headline distance figures, the visualisation clarifies how planning intent translates into built outcomes, supporting greater accountability in the process.
Appendix
Cost of cycling paths
Based on publicly available data
Award Date | Region | Contract Value | Expected Distance | Cost/km | Sources |
May 2025 | East Region (11 Towns) | S$258.3M | ~87km | ~S$2.97M | |
April 2024 | Western Singapore | S$92.9M | ~34.4km | ~S$2.70M | |
Aug 2023 | East Region (7 Towns) | S$188.3M | ~55km | ~S$3.42M | |
Jan 2023 | Central / City Fringe | S$78.3M | ~20km | ~S$3.91M |
News articles on positive sentiment of cycling paths built
More than 10km of cycling paths completed in Toa Payoh (Oct 2025)
Another 87km of new cycling paths to be built in Singapore’s east, north-east by 2030 (Aug 2024)
New cycling paths in 7 towns will be progressively completed from 2024: LTA (Jan 2023)
LTA to build 20km of new cycling paths in Bukit Merah, Kallang, city areas (Jun 2023)
Articles on the usability issues of current cycling paths
Land Transport Master Plan 2040
Summary
Opportunity
When cycling paths don't connect properly, Singaporeans can't use them to get to work or school, forcing more people into cars and buses. Despite significant investment in cycling infrastructure, our analysis of 203 MRT and LRT stations reveals that 42% have poor cycling connectivity, and cyclists face an average of 12 interruptions per kilometre around stations. Only 25% of stations have good or excellent cycling infrastructure for last-mile connectivity.
The problem isn't a lack of cycling paths—Singapore is building towards 1,300km by 2030. The issue is that current progress reporting focuses on total kilometres built, which doesn't capture whether these paths actually connect to form a usable network. A cyclist trying to reach Jurong East MRT might find cycling paths that stop abruptly, merge into crowded pedestrian walkways, or require confusing detours that make cycling slower than walking.
To understand why, we spoke with LTA's Active Mobility Group. While planners start with good intentions—connecting MRT stations within 400-600 metres—land constraints force compromises that create gaps. These individual trade-offs seem reasonable in isolation, but cumulatively result in the fragmented network that cyclists experience today. Feedback is handled case-by-case rather than systematically, making it difficult to spot broader connectivity patterns or prioritise fixes that would help the most people.
Velocity
We built two tools to make cycling network problems visible and actionable, moving beyond simple kilometre counts to metrics that reflect real-world usability.
Map Visualisation Tool: Our analysis of 203 stations (159 MRT, 44 LRT) revealed that the average cycling-to-road ratio is just 19.7%, below the 20% threshold for good connectivity. The tool measures three key factors within 1km of each station: how much cycling infrastructure exists relative to roads, how fragmented the paths are, and whether they actually connect to where people need to go. This shifts focus from "how many kilometres built" to "can people actually use this to get to the MRT?"
Feedback Heatmap Tool: Rather than waiting for individual complaints, we created a way for residents to show their preferred cycling routes between home and MRT stations. This captures where people want to cycle versus where infrastructure currently exists, helping prioritise which gaps to fix first.
Field Research: We conducted on-site observations around Jurong East MRT, interviewing cyclists and pedestrians about real usage patterns. This revealed that cyclists regularly travel 1-4 kilometres for daily trips—far exceeding the 400-600 metre planning assumptions—and highlighted practical issues like poor wayfinding and unsafe shared pathways that force conflicts between cyclists and pedestrians.
Traction
Our tools revealed connectivity problems that distance-based metrics miss entirely. For example, major roads that function as obvious cycling desire paths weren't fully planned or connected, while bidirectional shared pathways create safety conflicts where "differing speeds and directions increase conflict." Construction detours force cyclists to take significantly longer routes, and the absence of clear wayfinding from estates and MRT stations makes navigation difficult without local knowledge.
When we shared this work with a Member of Parliament, they noted that clearer, demand-driven information could enable town councils to step in with targeted local interventions where central planning is constrained. The visualisation makes network gaps visible at a local scale, supporting more targeted solutions.