Tooling & Productivity
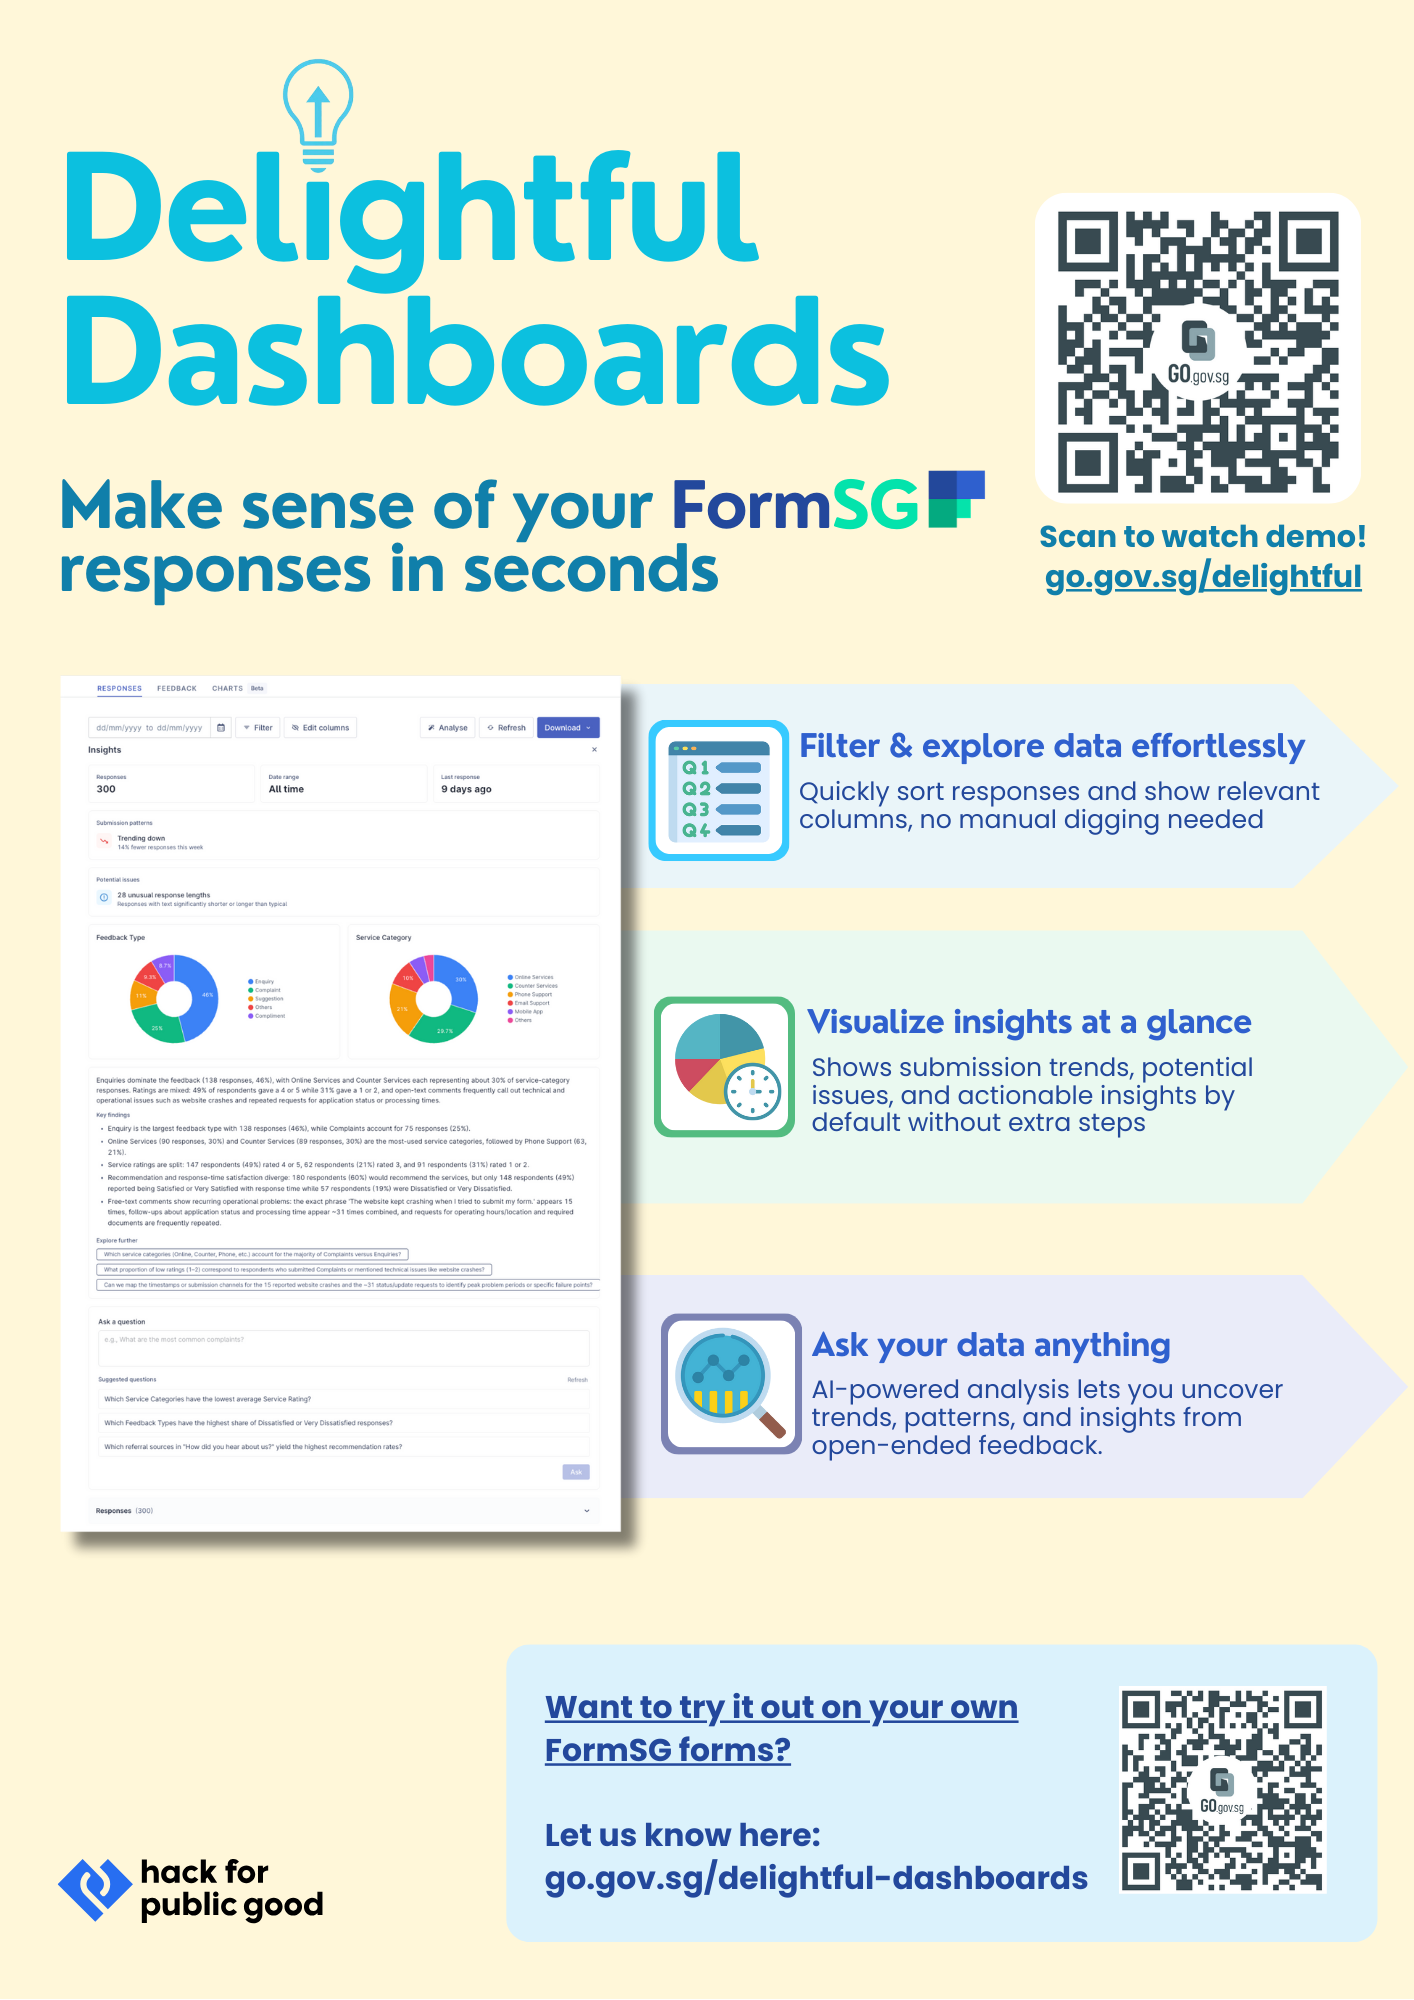
Delightful Dashboards
30 January 2026
Making post data collection processes more efficient and unlocking the power of data for everyday public officers.

Can't play the demo video here? Click to view on YouTube.
Opportunity — What problem are you working on, and why it matters
What real-world problem you are focused on
FormSG is one of the government’s most used products, focused on collecting data from citizens and public officers to drive government processes and decisions. While collecting data is simpler, post data collection processes are often still manual and tedious.
Who experiences this problem
For example, managing and making sense of data post-submission is one of the most common tasks any FormSG admin (public officer) would need to do.
These tasks include:
For government officers handling daily operations, they will need to find specific responses to update a citizen on their appeal application status.
For government officers deciding on how to make improvements to Singapore, they may need to summarize key feedback collected from a feedback form by reading paragraphs of responses one by one.
For finance staff managing expenditure, they may need to check which budget request has not been approved for a budget request form and why.
Currently, this process is tedious and requires downloading of a .csv file and filtering the results from excel. For day to day checks, this process is manual and administrative effort adds up.
Admins also find themselves regularly keeping their new form responses in sync with their data, and may sometimes miss critical form responses.
Also, if a form has many open ended text fields, it takes a long time for form admins to read through each response and gain key insights. While AI LLM tools like Pair exist, these AI tools may sometimes hallucinate and give inaccurate answers. Hence, we need the right tools to efficiently interpret our data and ensure AI responses are grounded by actual data.
Why it is worth solving
Hence, we aim to explore how improving the presentation of data and providing accurate interpretation capability to our FormSG dashboards can enable users to find relevant information faster and unlock the value of data for form admins across the whole-of-government.
Want to use this dashboard on your FormSG forms? Let us know your interest here
Velocity — What you actually built or changed in the last month
We introduce dashboard improvements, allowing form admins to view full responses and find relevant information quickly. AI-powered analysis is also introduced with safeguards on data accuracy through grounding based on real data.
The below 2 images showcase the differences between the dashboard presentation
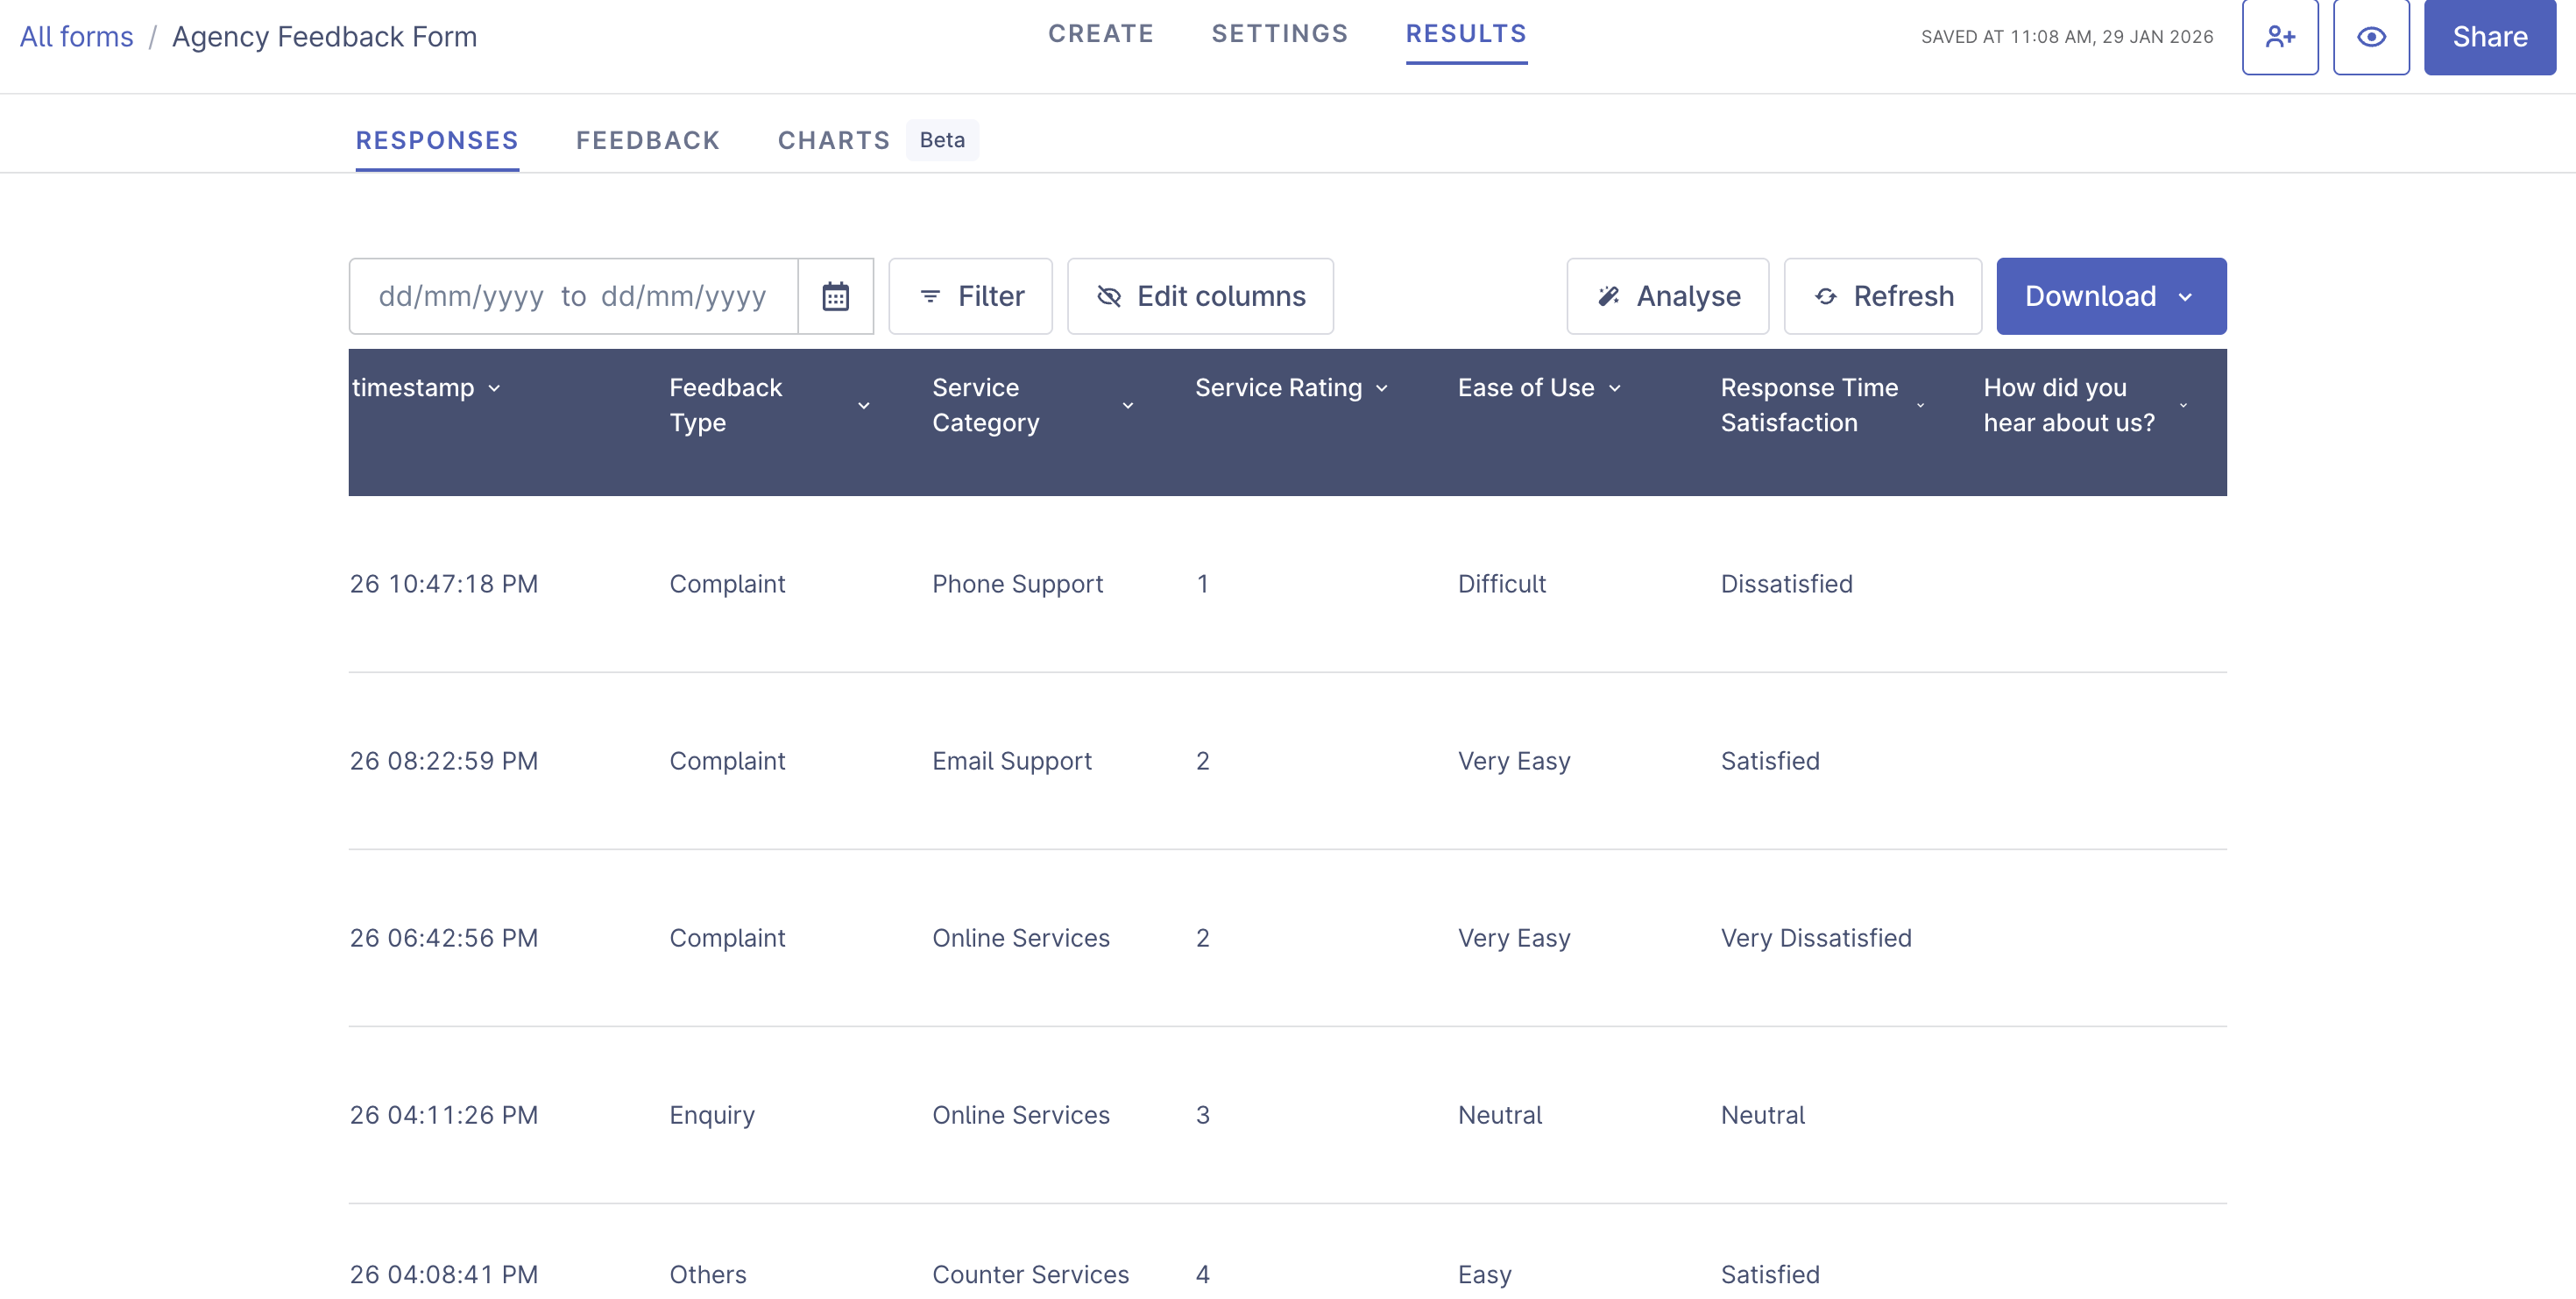
Detailed data presentation, with fields shown and filter functionality
Previous dashboard before hackathon
Previously, due to our responses being stored encrypted, supporting filtering functionality was a slow and expensive process as each response needs to be first decrypted. However, with some browser optimizations, we are able to make the decryption and filtering performant.
Making data more accessible to public officers
While tools like Plumber Tiles existed previously, the learning curve of adopting and understanding multiple tools and integration complexities made adopting this inaccessible more many public officers. Hence, we are exploring if better integration / unified platform can reduce the learning curve for majority of public officers, making higher value data work more accessible.
Solving the problem of LLM hallucinations by bringing 100% accurate AI analysis capabilities to users
We also introduce AI analysis tools to allow administrators to “Ask their data anything”. Such functionality is available for employees of many private companies and commercial tools.
By providing analytics capabilities directly compared to using external LLMs, we can make prompting their data simpler, handle larger numbers of response analysis through aggregations and ensure data accuracy. This is done by verifying the output against the raw data we own. This can unlock value for our public government officers to better help serve Singaporeans.
For example, providing summary of form responses:
“What is the most common service category used to provide feedback?"
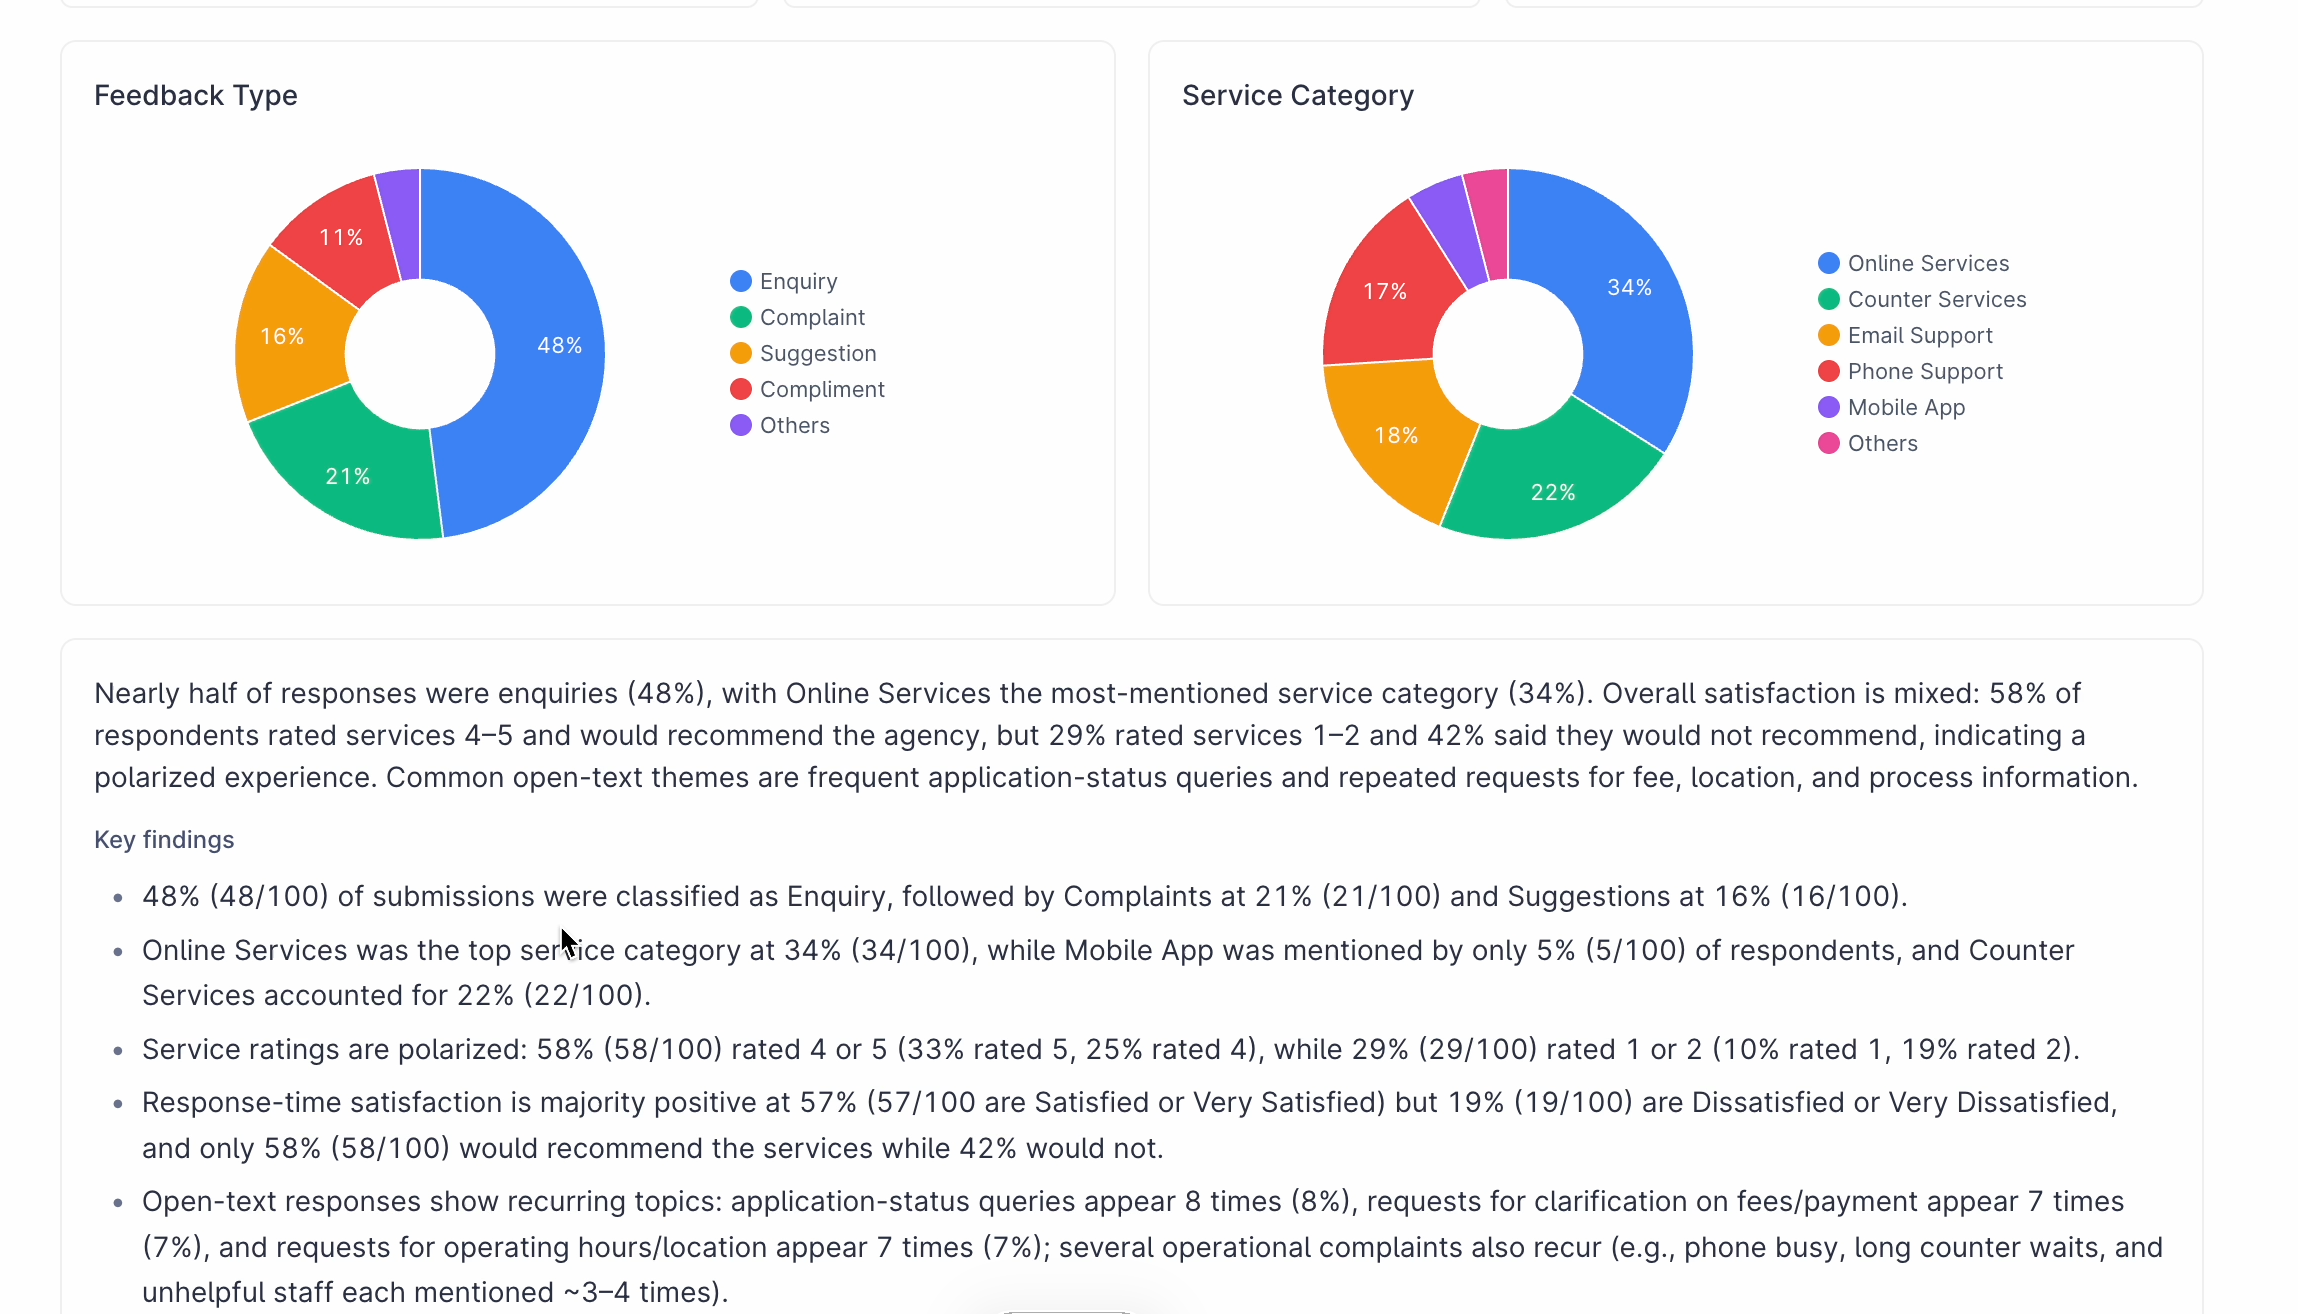
The summary shows that online services are the most common means of providing feedback.
Asking specific questions and seeing visualizations:
"What is the most common complaint received?"
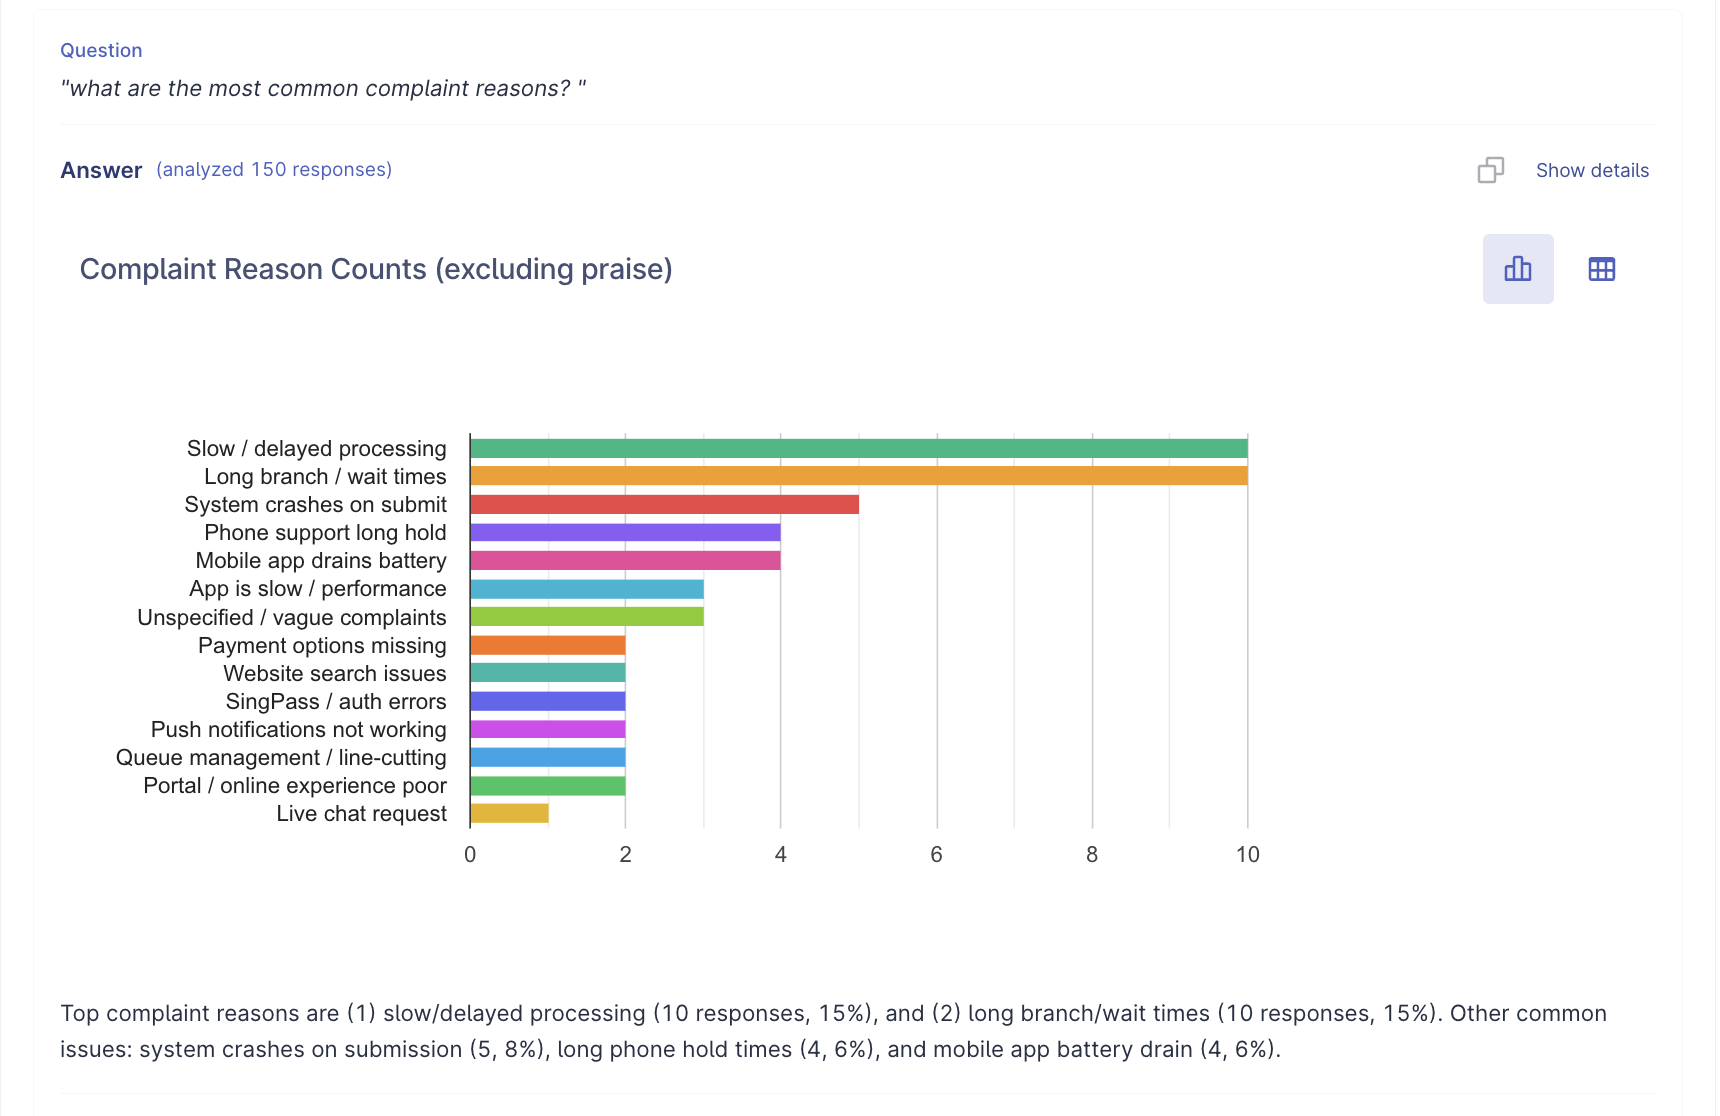
Long branch and wait times and slow processing is highlighted as issues and verified by actual data counts, allowing the agency to know what to prioritize next.
By providing quick and accurate means public officers can understand their data, we believe this will help drive better decisions and services in the public service.
Traction — How real people are using it, and what is happening as a result
Feedback from 1-1 user testing sessions
So far, we have conducted user testing with 18 public officers, ranging from school staff, healthcare and various agencies throughout the government.
We understand their current processes before dashboard improvements and share the prototype with them, allowing them to use the functionality and hear their organic thoughts.
Based on our findings, we hope to bring these data presentation and accurate AI capability to FormSG, either via direct implementation on the platform or as a separate tightly integrated service.
Metrics
Scoring provided by admins from 1-5 (Higher is better)
Table caption
Metrics | Previous | Delightful Dashboards | Change |
|---|---|---|---|
Avg Usefulness | 2.24 | 4.29 | +2.55 |
Avg Ease of Use | 4.57 | 4.52 | -0.05 |
Top Insights
1. Estimated 30–50% reduction in time taken to process, driven by fewer steps and streamlined workflows.
Several admins saw the new dashboard’s value primarily in its ability to collapse multiple workflow steps into one place. Time savings were mostly related to the data cleaning process, particularly in terms of being able to 1) identify submissions directly on the dashboard and 2) export and share submissions based on their own filters.
for the analyze [function] I can just copy and paste and put into powerpoint reporting structure and give the first cut— Form Admin, MINDEF
Don’t need to download CSV and copy over new responses…don’t need to maintain a separate excel sheet— Form Admin, PUB
2. Majority of admins rated the “Filter” feature as the most valuable improvement compared to the current dashboard
Many admins shared that the current workaround to export all submissions to CSV to filter and sort submissions adds manual overhead for routine checks and consumes system resources.
With the new dashboard, friction is removed via the "Filter" function. Admins can quickly search for specific submissions or narrow results without exporting data, and tailor the table to surface only relevant fields. This makes it easier to review submission details at a glance and follow up faster, with fewer steps and less clutter.
I like how I can see everything from the dashboard like the company name... [I] don't need to maintain a separate excel sheet— Form Admin, PUB
download[ing] the whole dataset… can take around 15-20 mins ... if I can reduce the size of the data that I export then I can do quick checks— Form Admin, MINDEF
3. “Analyze” is a good starting point for admins to quickly extract general insights and quick summations
Analyze function can serve as a strong starting point for insight-generation by reducing effort for everyday analysis while remaining accessible to non-technical admins.
Most admins were satisfied with the chart outputs and felt that the prompt-driven summarization and simple insights was helpful enough especially for synthesizing text based answers (ie. summarising top complaints, identify patterns in submissions behavior, repeat/duplicate responses).
this is a good starting point for investigation work to begin if you have a much large data set and the AI can identify the majority (themes)… if the AI can give you the insight quickly, it shortens our process… takes away the initial difficulty of classifying feedback— Form Admin, SGH
interpret will be most useful… [because we are already] familiar with other AI tools— Form Admin, LTA
HFPG26 Demo Day Signups
During the demo day, we created a interest form to gauge interest in this functionality. From 2pm-4.30pm, Delightful Dashboards received 31 signups by public officer visitors across ~10 different agencies (ranging from healthcare, education, social services etc) to register interest in using the functionality for their upcoming use cases.
The future of Delightful Dashboards
Through this hackathon, we see that there is value and demand in providing data capabilities to public officers in making their work more data-driven and efficient.
We envision a whole of government data analytics platform to bring the tools day to day officers need to find, manage and interpret their data quickly while being extremely simple to use.
This is achieved by:
Being tightly integrated with existing government tools such as FormSG
Providing the necessary abstractions to make interpreting data accurately simple
Being intentionally limited in scope, but doing what it does well with great UX and with high accuracy.
What's could be next?
Connected dashboards (data sheets), similar to Google sheets but with a more scoped functionality and simpler UX. This allows the AI to use data across multiple data sources and users to SQL join/vLookup their data between multiple data sources, which is generalizable to many use cases and powers data pre-fills.
Editable and collaborative dashboards (this can be done with notion-inspired database schema design)
Able to correlate specific findings with actual responses/data rows (eg, response ID 1 and 2 are duplicates, which the admin can then look at in more detail) which is a common pain point from FormSG's ground research.
Enabling 100% accurate and verifiable responses via building a set of AI skills that work on the raw data instead of inference. (aim to abstract away the task verifying the LLM's output with engineering methods)
Saved user-defined visualizations to come back to.
Close integration with FormSG (dashboards/data sheets are a first-class integrated & supported feature for many commercial form builders such as Fillout, Cognito forms, Notion forms, Google forms etc and should similarly be a core functionality for FormSG as it enables many higher value tasks)
Team members:
Kevin Foong, Ruchel Phua, Hueyyin Chang, Sebastian Wong, Kaylynn, Ha (Vietnam Guest)